Totals and Grouped Totals
Any query showing numbers can show what they add up to. Totals appear at the foot of the grid; grouped totals add a subtotal for each group as well.
Turning Totals On
Open a query and choose Format. The display options are listed together:
| Option | Shows |
|---|---|
| Chart | The results as a chart |
| Table | The results as a grid |
| Grouped table | A grid broken into groups |
| Totals | A grid with a total row at the foot |
| Grouped Totals | A grid with a subtotal per group, and an overall total |
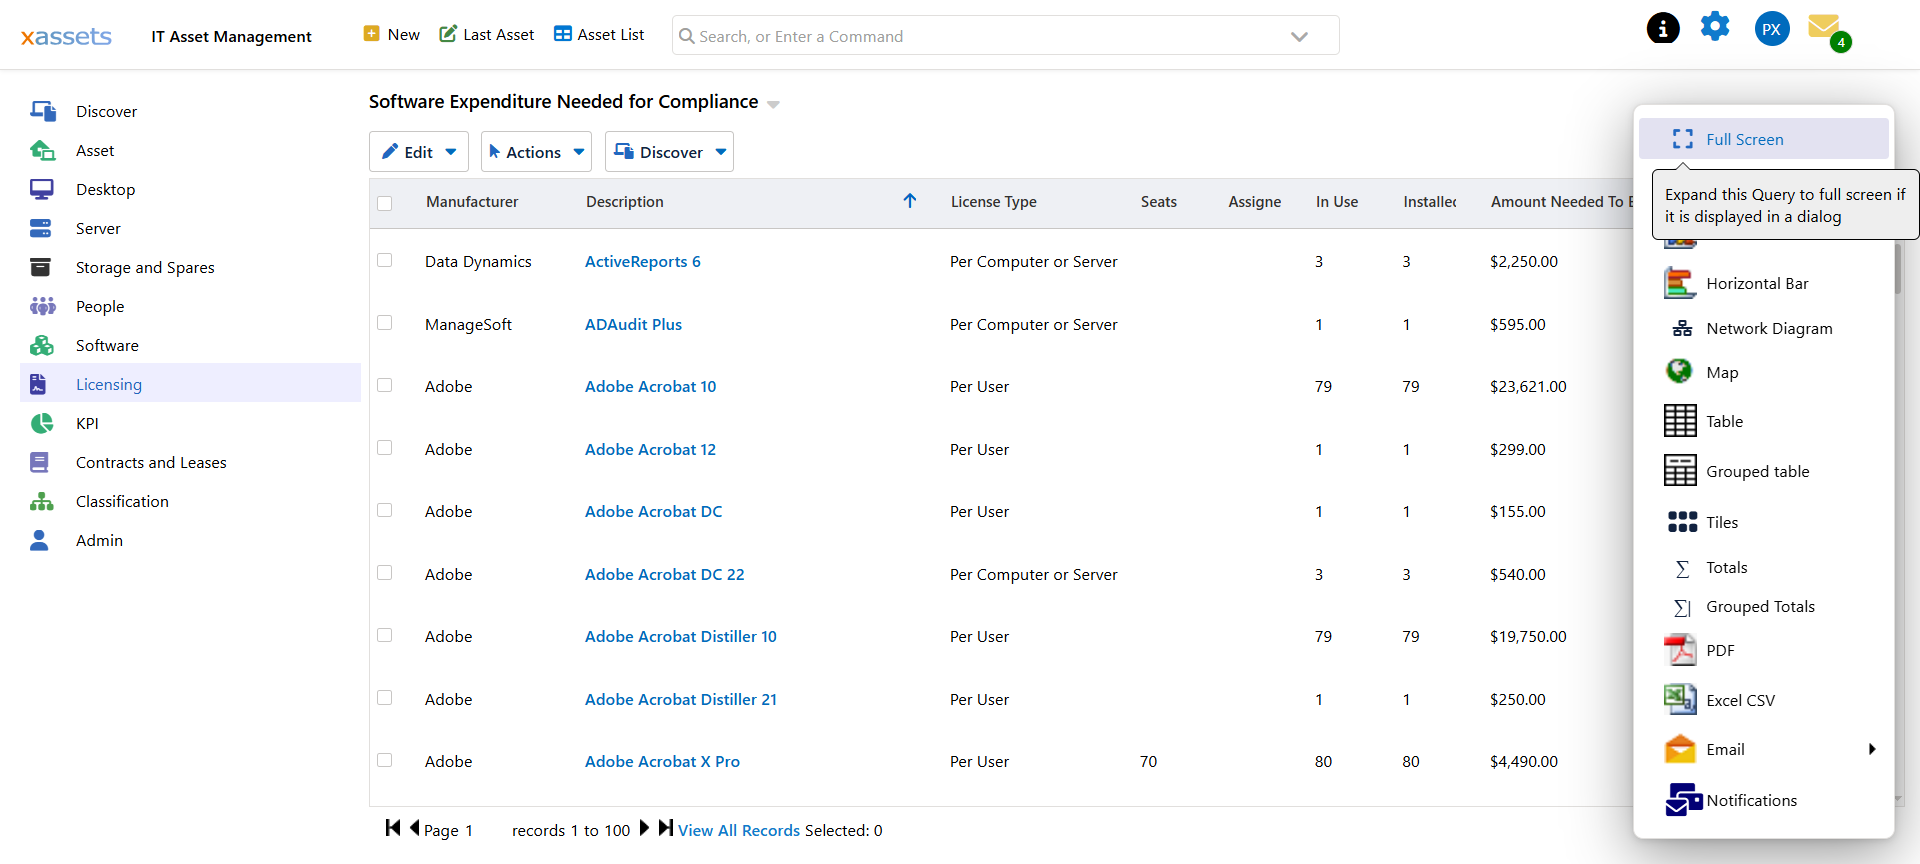
Totals used to be available only when a query was displayed as a chart. They now work for tables too, which is where they are most useful — you can read the individual rows and the total together.
Where the Total Appears
At the foot of the grid, after the last row. On a long result set you have to scroll to the bottom to see it.
This trips people up: switching to Totals on a query with several hundred rows appears to do nothing, because the total is far below the visible area. It is there — scroll down, or filter the query to fewer rows first.
Grouped Totals put a subtotal at the end of each group, with the overall total at the very bottom.
Which Columns Get Totalled
Numeric columns are totalled. Text and date columns are left blank in the total row.
A column that holds numbers but is not recognised as numeric will not total. This happens most often on queries written directly in SQL, where a calculated column can come back as text. If a column you expect to total stays empty, check the column's type and formatting in the query definition — see Query Columns and Display.
Choosing Between Them
Totals answers "what is the whole thing worth". Use it on a query the user reads end to end — a compliance shortfall, a month's spend, a stock count.
Grouped Totals answers "how does it break down". Use it when the groups are the point: spend by department, licences by manufacturer, assets by location. Grouping needs a sensible grouping column — grouping by something near-unique produces a subtotal per row, which is noise.
Making It the Default
The Format menu changes the display for the current view. To make a query always open with totals, set its presentation in the query definition, so every user gets it without choosing.
That is usually the right move for a report whose whole purpose is the number at the bottom. Leave it off for exploratory queries, where the total is rarely meaningful across a filtered subset.
Related Reading
- Query Columns and Display — column types and formatting
- Query Sorting and Report Design
- Creating a Query