Query Columns and Display
This page covers everything related to how columns are configured and displayed in queries, including column properties, ordering, sizing, and presentation hierarchies.
Editing Column Properties
To edit the properties of a column, including its presentation, click the field name link or select a column and click the 
The information for the field will change depending on the Display Type of the column:
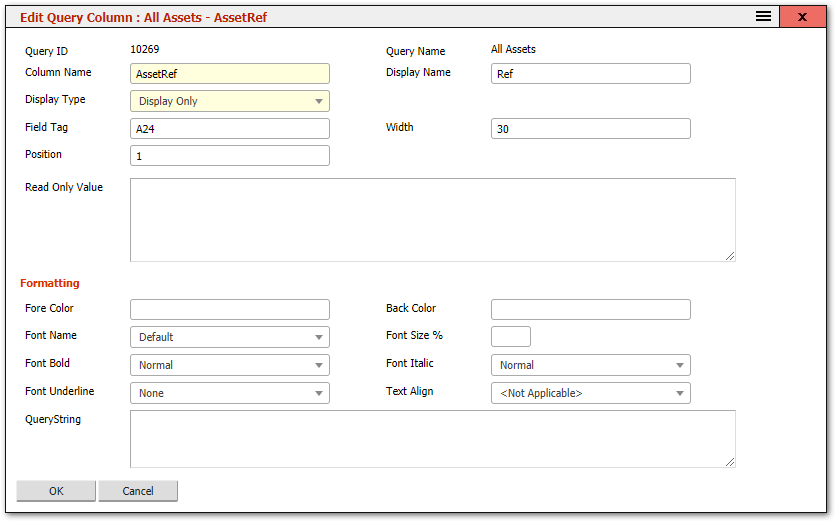
Column Name: This determines the field in the base query from which data for this field comes from. It is automatically filled in when a column is Inserted into the query unless the column is a Custom Column. If the Field Name is edited a second column will be generated on save, and the original field name will still be present in the query. This is a useful means of cloning a column within a query.
Display Name determines the actual name of the column as displayed in query results.
Display Type determines how the column is displayed:
- Display Only: will simply include the column in the query, displaying the data from the table.
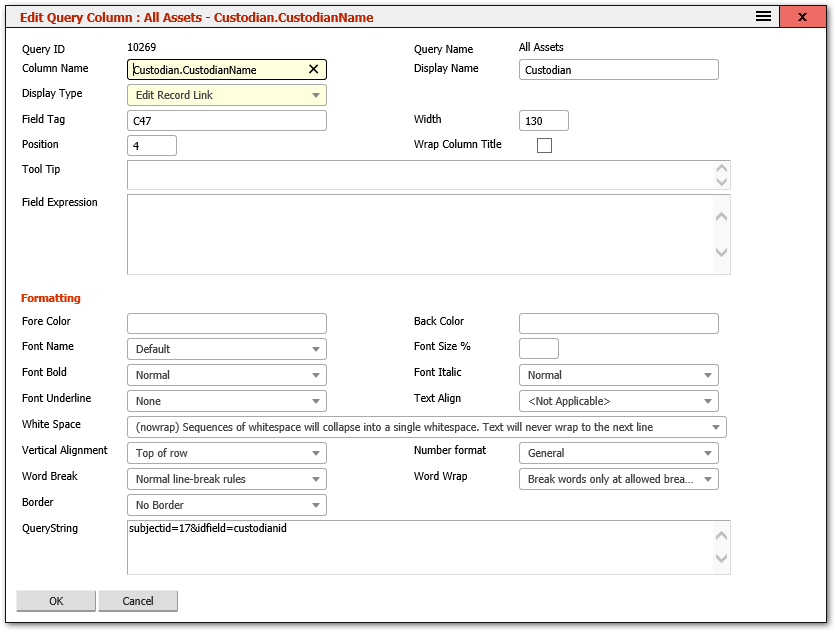
- Edit Record Link: will make the column a clickable link. When the user clicks the column, the corresponding record will be edited. The record to be edited is determined from the Query Subject and ID field in the current row of data. This can be overridden by specifying the SubjectID and IDField to use in the Querystring. For example, to edit a Custodian record by clicking the Custodian name in an Asset based query, the Querystring would be
subjectid=17&idfield=custodianid
Alert Link: will display the data with a hyperlink that will show the column data in a message box if the column is clicked. This is useful for large columns where most of the data is hidden because the column width is not wide enough to contain it all.
Check Box: This will display a checkbox value, 1 or 0 as Yes or No.
Hidden Column: This will include the column in the Query, but it will not be visible to the user. This is useful for cases where a column data is needed but is not necessary for the user to see it, such as ID fields for foreign tables used for Edit Record columns.
Asset Link: This will specifically link to an Asset record that is represented in the row and if the user clicks this column, that asset will be opened in the Asset Editor.
Field Tag is read only for internal use only and should not be changed.
Width determines the width of the column in pixels.
Position determines where this column is placed in relation to the other fields in this query.
Wrap Column Title: This can be checked for long column titles to enable them to wrap rather than be truncated.
Tool Tip: text that is displayed as a tool tip when the user hovers the mouse over the column title.
Read Only Value / Field Expression
The Read Only Value/Field Expression is where an expression can be entered to override the value for the column. For example: a calculated result based on other columns in the Query. If the entered text is not SQL, then the text will be displayed as the value for this column. A TEMPTABLE can also be used here to specify a subquery for the data in this column. A TEMPTABLE expression takes the form:
TEMPTABLE: Alias.KeyFieldName,
Select KeyFieldName, Expression As FieldName
from Table Where SomeOtherField = SomeValue
Where:
- Alias is a name that is assigned to this subquery so that it can be referenced in other columns and the Query Filter.
- KeyFieldName is a field which exists in the query and also is the first field in the above SQL statement.
- Expression is any SQL expression or field.
- FieldName equals the fieldname for this column.
- The SQL statement itself can be any valid SQL statement.
Column Styling Properties
- Fore Color: determines the foreground color of the column. Any valid HTML colors can be specified here.
- Back Color: determines the background colour of the column. Any valid HTML colors can be specified here.
- Font name determines the font of the column and should be restricted to commonly used browser fonts such as Arial, Verdana, Tahoma, etc.
- Font size % determines the font size of the column as a percentage.
- Font Bold determines if the column is presented as Bold.
- Font Italic determines if the column is shown in italics.
- Font Underline enables the column data to be underlined, overlined or struck through.
- Text Align determines how the column is centered; the default is "Left" alignment.
- White Space: determines how the white-space such as spaces and tabs are handled and whether columns with long contents are truncated or wrapped to the next line.
- Vertical Alignment: specifies whether the value in the column is displayed at the top, middle or bottom of the row. This is only relevant if a column in the row is taller than a single line of text, either due to it containing an image, or multiple lines of text due to wrapping.
- Number Format: specifies how numbers are displayed in the column, such as whether to show a currency symbol and decimal places.
- Word Break: how to treat breaking of words in cases where text wrapping is used in the column.
- Word Wrap: rules for breaking words using hyphens.
- Border: display a border around the column. This is especially useful for multi-line values to help distinguish records from each other in the query.
- QueryString is only available to Configuration Users and can contain advanced settings that further modify how the column is displayed.
Reordering Columns
The order that the columns appear in the Query Columns tab of the Query Editor will be the order in which they appear in the displayed query. The top-most column, Position 1, will display as the left-most column when the query is run. The column order can be changed by editing the column and typing in a new Column Position, or:
- With one or more columns selected, click on the

- With one or more columns selected, click on the

Resizing Columns
The width of the query column will determine how much data from the field is displayed in the column with the remaining data hidden. The width value is the number of pixels wide the column will be. The width of the column can be changed by editing the column and entering a new width or:
- With one or more columns selected, click on the

- With one or more columns selected, click on the

Presentation and Drilldown Hierarchy
The "Presentation" tab is used to determine the drilldown hierarchy of the query, and that same hierarchy also determines the default structure of the "tree" on the left side of the screen when the query runs. It is also used in automatically generated PDF reports to provide grouping for the records.
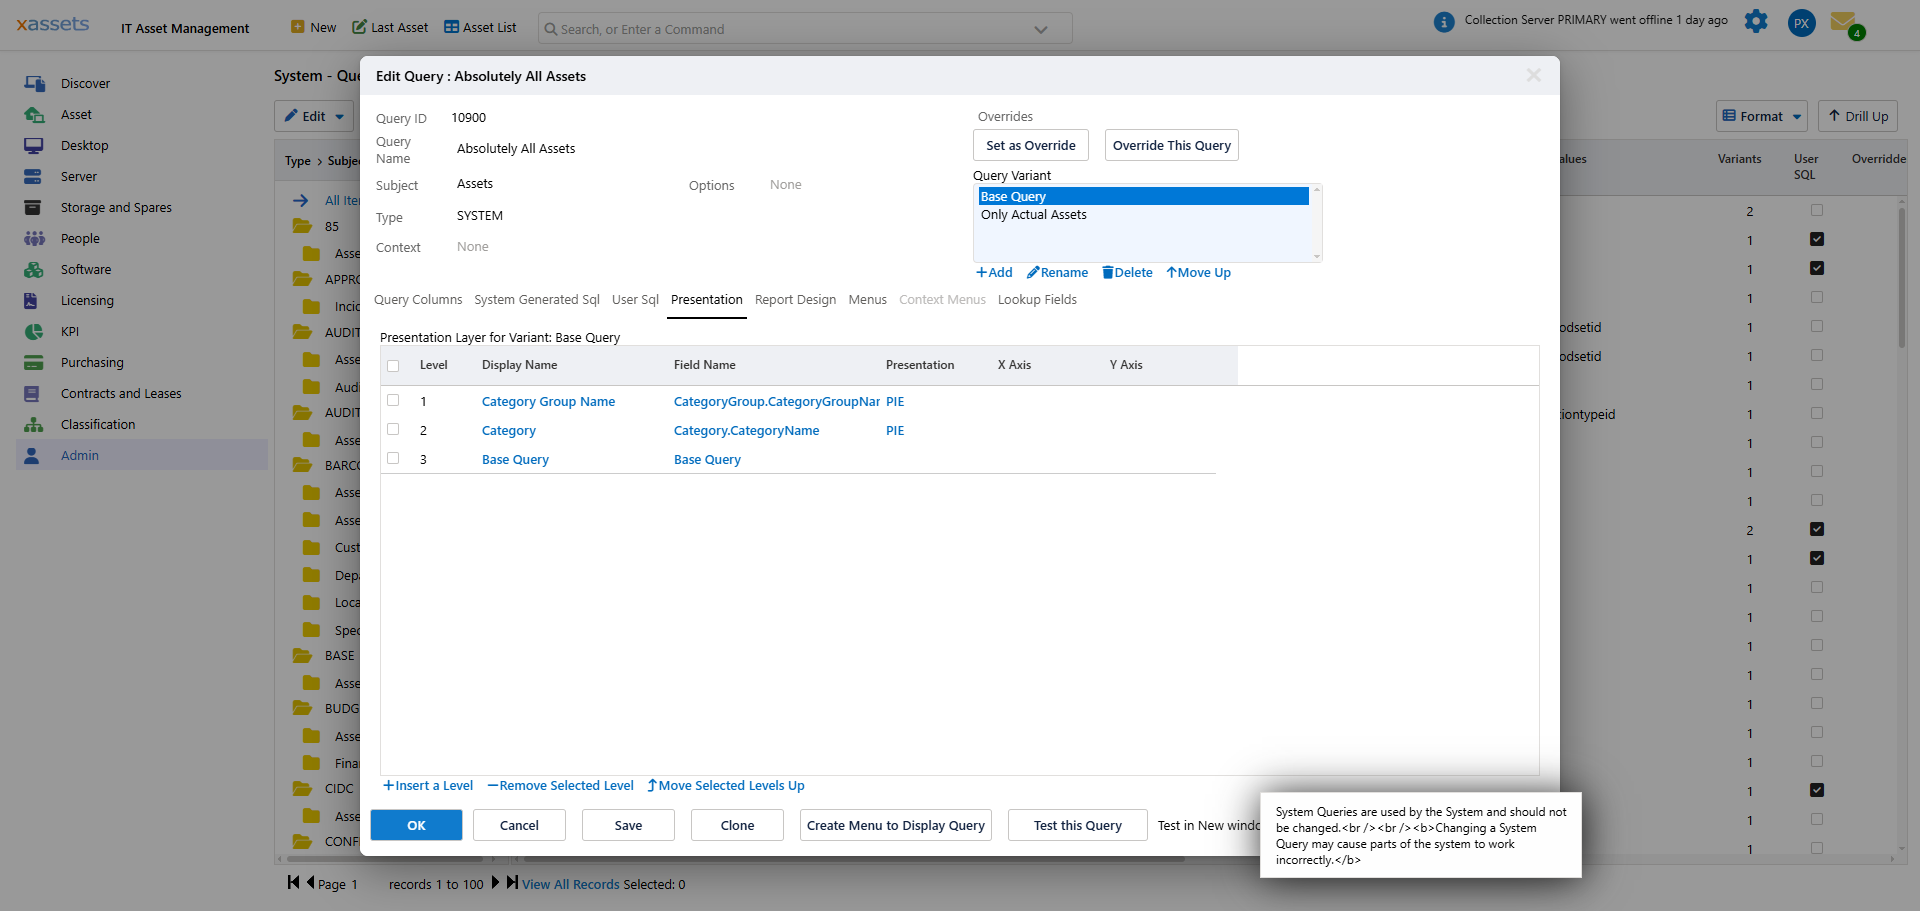
Click on "Insert a Level" to create a new presentation level based on the columns in the query. The new level will be inserted at the top, as level 1 unless another level is selected, in which case, the level will be inserted above the selected level. Edit an existing level by clicking on the Display Name, Field Name or Presentation column.
The Presentation level entry dialog will appear:
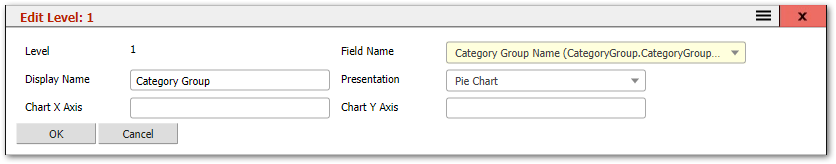
When Y Axis (values) is not filled in, the default is to report the count of the number of records in each group. Other options include Min(), Max(), Avg(), Sum(), etc.
To delete a level, use the "Remove selected Level" link.
Tip: The presentation hierarchy is also used to generate charts on dashboard pages. The first level determines the chart's X axis (categories), and the Y axis displays the count or aggregate value. Configure the hierarchy with charting in mind if the query will appear on a dashboard.
Related Articles
- Editing a Query — the query editor dialog and tabs
- Query Record Filters — filter conditions
- Query Sorting and Report Design — sort orders and PDF reports
- Query Parameters — parameterised queries
- Advanced Query Techniques — User SQL and TEMPTABLE expressions