Hardware Analysis by Attribute
The Inventory Queries tab on the Asset Inventory Dashboard provides a library of pre-built queries that let you analyse your hardware estate by specific attributes such as CPU speed, memory, disk size, and manufacturer. This page describes each query and how to use them for hardware planning and analysis.
Accessing Hardware Queries
Click the Inventory Queries tab at the top of the Asset Inventory Dashboard. The queries are organised into three columns. The Hardware column in the centre contains the hardware-specific queries:
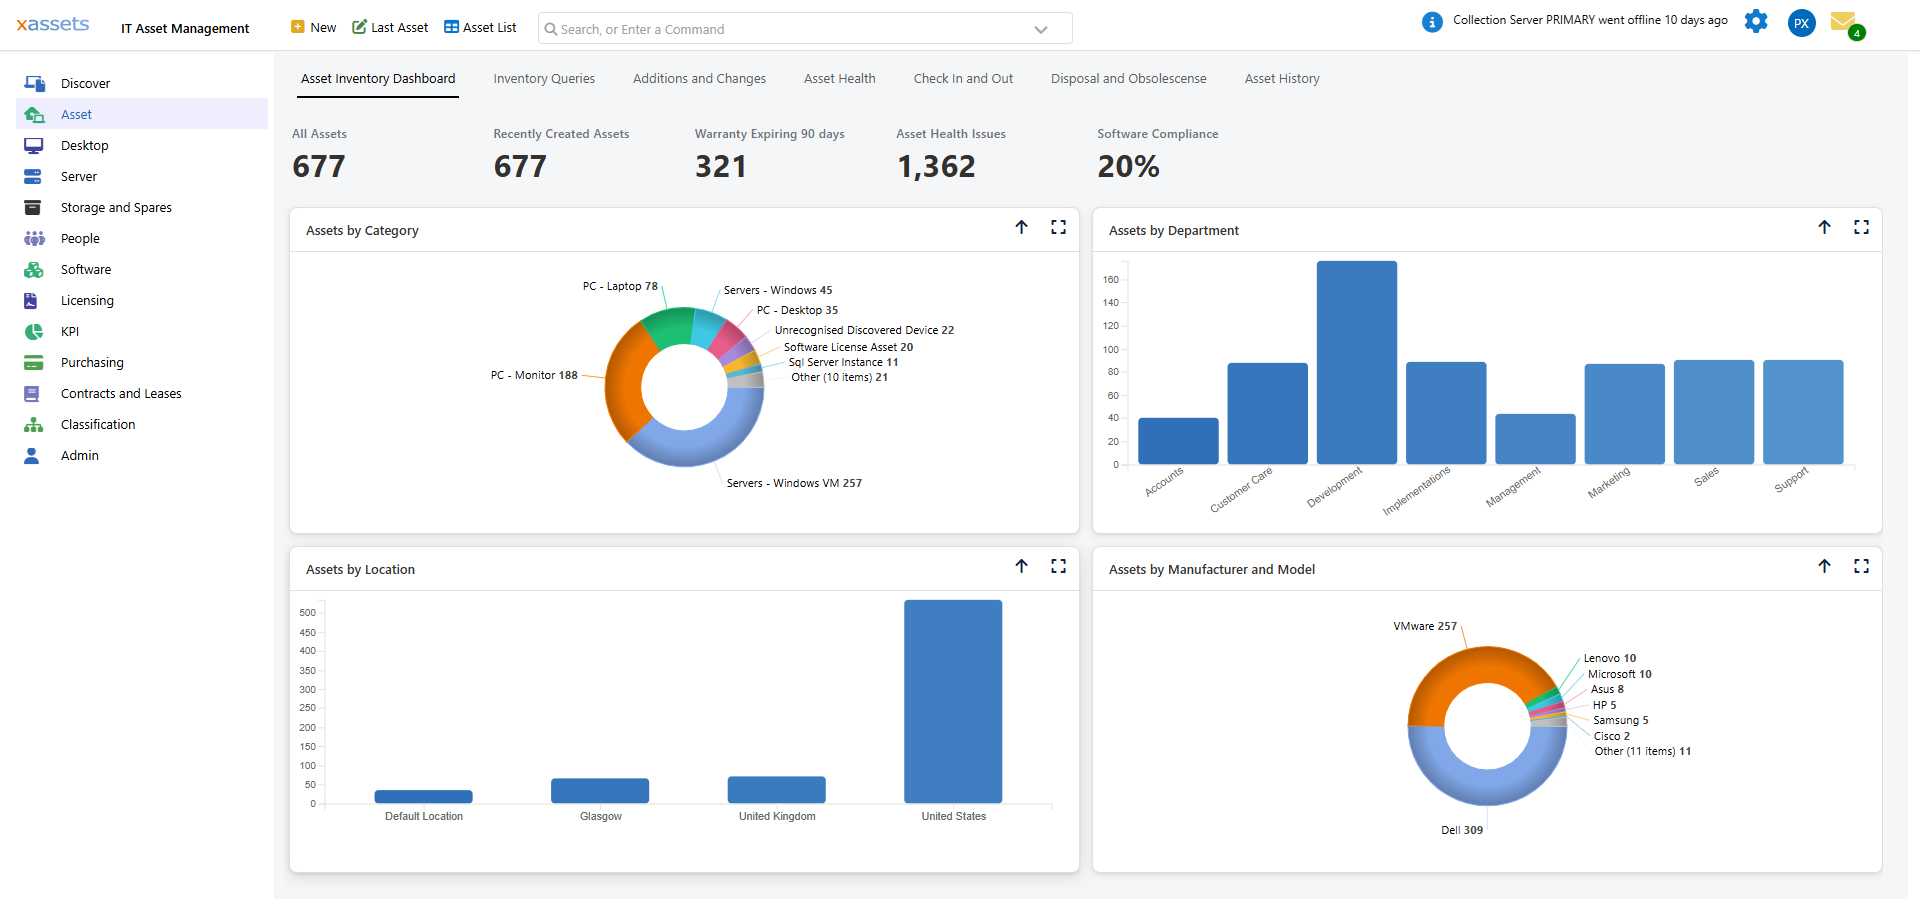
Available Hardware Queries
| Query | What It Shows | Common Use |
|---|---|---|
| Assets by Manufacturer and Model | Groups assets by hardware manufacturer (e.g., Dell, Lenovo, HP) and model | Standardisation planning, vendor negotiations |
| Computers by CPU Speed | Groups computers by processor speed | Identifying machines that may need upgrading for new software requirements |
| Computers by Memory | Groups computers by installed RAM | Highlighting machines with insufficient memory for current workloads |
| Computers by Disk Size | Groups computers by total disk capacity | Capacity planning and identifying undersized storage |
| Computers by Disk Space | Groups computers by available free disk space | Spotting machines running low on storage before they cause problems |
| Computers by Domain Name | Groups computers by their Active Directory domain | Network segmentation analysis, identifying machines in the wrong domain |
| Assets by IP Subnet | Groups assets by network subnet | Network planning, segmentation review, security zone mapping |
| Cloud Assets | Lists assets discovered from cloud platforms (AWS, Azure, Google Cloud) | Cloud inventory management and cost tracking |
| Computers by Firewall Rule | Groups computers by their firewall configuration | Security compliance checking |
Running a Query
- Click any query name to run it. The query opens with a chart in the main panel and a group tree down the left side (for Assets by Category this is a donut chart broken down by category, with the category hierarchy listed on the left):

- From the query results you can:
- Click a tree item on the left to drill down into a specific group (e.g., click a category or manufacturer name to see only that group's assets).
- Click "All Items in Query" at the top of the tree to switch to a flat grid of every record the query returns.
- Click an asset's description in the grid to open the Edit Asset dialog and view the full details for that machine. See Discovered Data for a Single Asset.
- Use the Format button in the top-right corner to switch the display -- Pie, Bar, Horizontal Bar, Network Diagram, Map, Table, Grouped Table, Tiles, Totals, or Grouped Totals.
- Export the results from the same Format menu, using Excel CSV or PDF, or send them by Email.
Note: Some hardware queries (CPU Speed, Memory, Disk Size, Disk Space) depend on discovery having collected that specific data point. If a query returns "No data for this chart" or "This query or the current selection returned no data", it means no assets in your estate currently have that attribute populated -- run a discovery scan to populate it, or check that the relevant Computer Details fields are being collected.
Classification Queries
The Classification column on the left provides queries that group assets by organisational attributes rather than hardware attributes:
- Assets by Category, Location, Department, Cost Centre, Status, Custodian, Supplier, and Company.
These are useful for answering questions like "How many assets does each department have?" or "Which locations have the most equipment?"
Software and Health Queries
The right-hand column covers software and health:
| Query | What It Shows |
|---|---|
| Computers by Operating System | Groups by OS name and version -- useful for tracking OS migration progress |
| Computers by Operating System - Fully Discovered | Shows only computers where discovery completed successfully, excluding partial results |
| Computers by Patch | Identifies machines missing critical updates -- important for security compliance |
| Computers by Installed Software - Primary | Groups machines by their primary installed application |
| Computers by Installed Software - All | Groups machines by every application installed, not just the primary one |
| Assets by Health Issue | Lists assets with active health alerts requiring attention |
| Computers by Assigned Software License | Shows license assignment coverage across your estate |
Analysis of software data in more depth is covered in the Software Asset Management Guide.
Custom Queries
If the built-in queries do not cover your needs, administrators can create custom queries from Admin > Queries. Custom queries can group, filter, and chart any combination of asset fields, including discovered hardware attributes and custom specification data. See the Configuration Guide for details on building queries.
Tip: Hardware queries are particularly useful during refresh planning. Run "Computers by Memory" and "Computers by CPU Speed" to identify machines below your minimum specification threshold, then use the results to build a business case for replacement.
Tip: Export query results to Excel for further analysis. Choose Excel CSV from the Format menu -- it exports the full result set, not just the current page.
Tip: Save time by bookmarking frequently used queries. Your administrator can also add commonly used queries to dashboard tabs or menu items for quick access.
Related Articles
- Asset Inventory Overview - the main dashboard and KPI tiles
- Analysing Discovered Data - using charts and queries after discovery
- Discovered Data for a Single Asset - viewing detailed data for one asset