Asset Inventory Overview
The Asset Inventory Dashboard is the starting point for understanding what is in your IT estate. It provides headline KPI tiles, interactive charts, and pre-built queries that let you analyse your hardware and software inventory from multiple angles. This page explains how the dashboard is structured and what each section shows.
Accessing the Dashboard
The dashboard appears automatically when you log in with the IT Asset Management profile. You can also reach it at any time by clicking Asset in the left-hand menu bar and selecting Asset Inventory Dashboard.
KPI Tiles
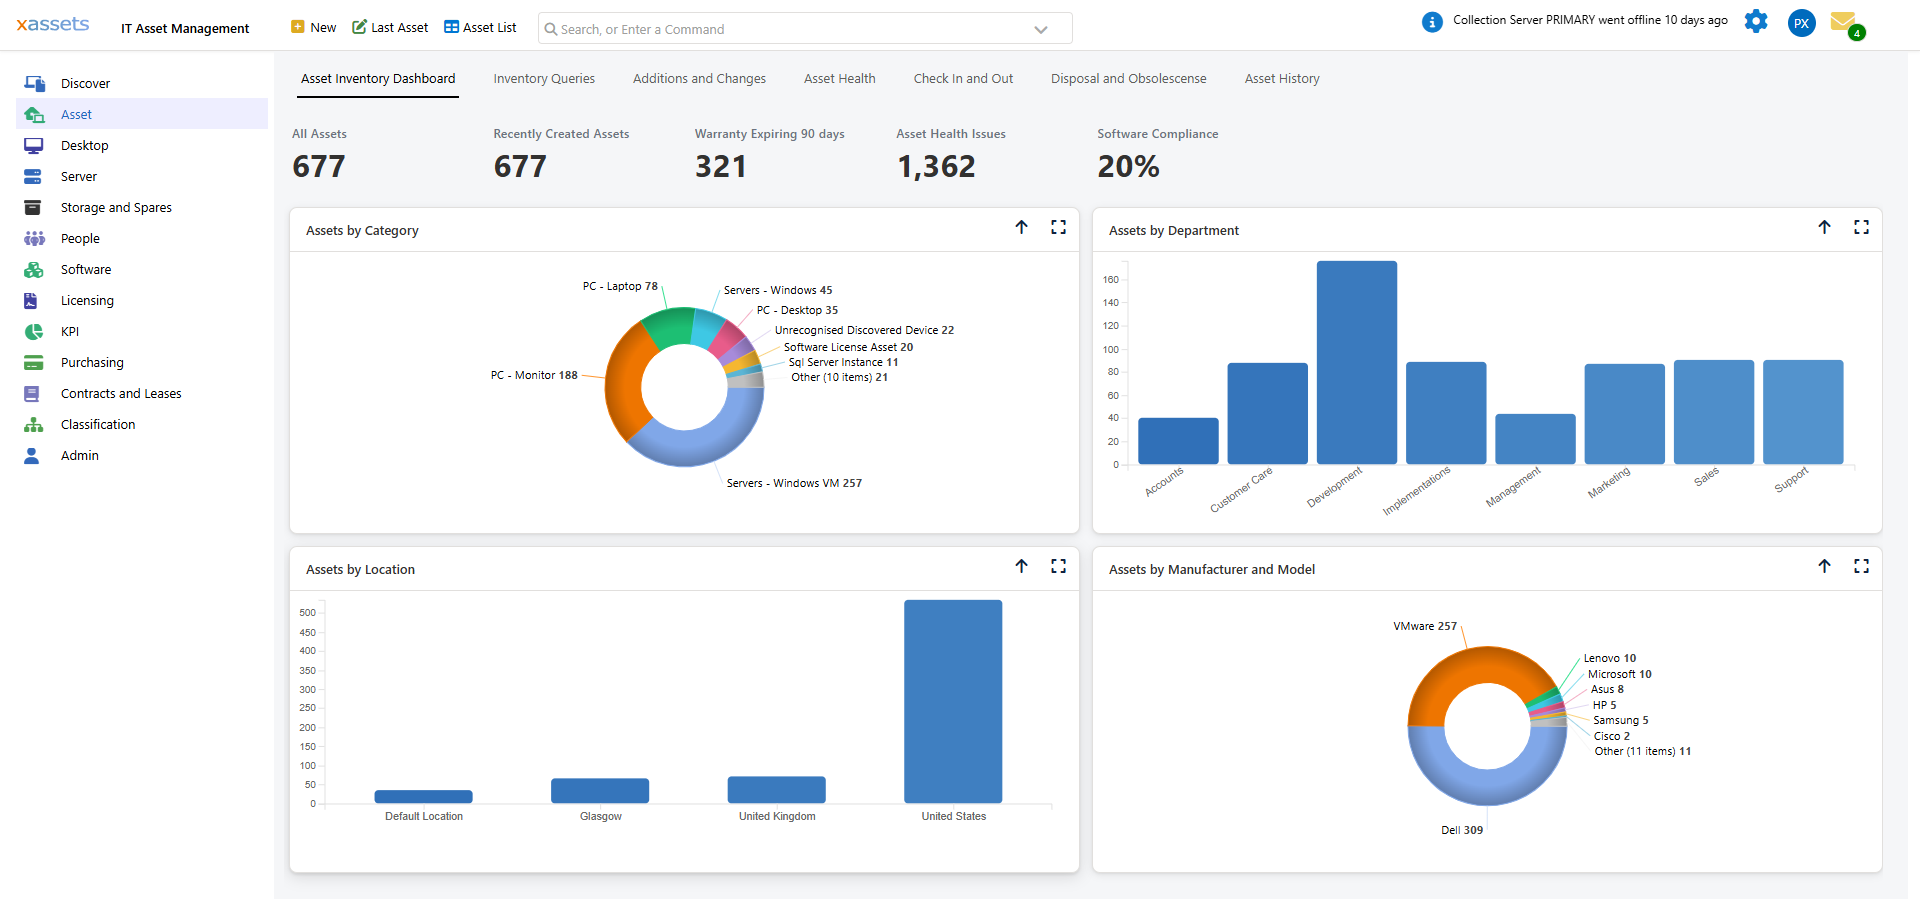
The row of tiles across the top of the dashboard provides headline numbers at a glance:
| Tile | What It Shows |
|---|---|
| All Assets | Total number of active assets in the system |
| Recently Created Assets | Assets created in the current reporting period |
| Warranty Expiring 90 days | Assets whose warranty end date falls within the next 90 days |
| Assets with Health Issues | Assets flagged by health-check rules (e.g., low disk space, outdated OS, missing patches). See Asset Health for the full list of rules. |
| Software Compliance | Percentage of software installations that are correctly licensed |
Click any tile to drill down to the underlying list of assets. For example, clicking "Warranty Expiring 90 days" displays a full list of those assets, allowing you to plan warranty renewals or replacements.
Tip: The KPI tiles provide an instant health check of your estate. Make it a habit to review them each morning -- a sudden increase in "Assets with Health Issues" or a drop in "Software Compliance" may indicate a problem that needs attention.
Charts
Below the KPI tiles, four charts give a visual breakdown of your inventory:
- Assets by Category -- a donut chart showing the distribution across asset categories such as PC - Desktop, PC - Laptop, Servers, Monitors, and Network devices.
- Assets by Department -- a bar chart showing how assets are distributed across organisational departments.
- Assets by Location -- a bar chart grouping assets by their assigned location.
- Assets by Manufacturer and Model -- a donut chart showing the hardware manufacturers and models in your estate.
Each chart has two icons in its top-right corner:
- Up arrow -- drill up to the next level in the hierarchy
- Full screen -- expand the chart for a more detailed view with filtering and export options
In full screen mode you can click individual chart segments to filter the results. See Analysing Discovered Data for more on working with charts.
Dashboard Tabs
Along the top of the dashboard area, tabs provide access to additional views:
| Tab | Purpose |
|---|---|
| Asset Inventory Dashboard | The main dashboard described above |
| Inventory Queries | Pre-built queries grouped by Classification, Hardware, and Software. See Hardware Analysis by Attribute. |
| Additions and Changes | Recently added or modified assets -- useful for reviewing what changed since your last check |
| Asset Health | Assets with health issues requiring attention (e.g., low disk, outdated OS). See Asset Health. |
| Check In and Out | Library-style asset check-out tracking for portable equipment |
| Disposal and Obsolescence | Assets due for disposal or approaching end of life. See Disposal. |
| Asset History | Historical change log for assets -- see who changed what and when |
Left-Hand Menu
The left-hand menu bar provides direct access to asset categories and functional areas:
Asset-related: Discover, Asset, Desktop, Server, Storage and Spares, People
Software and licensing: Software, Licensing
Other areas: KPI, Purchasing, Contracts and Leases, Classification, Admin
Each menu item opens a set of queries, dashboards, and forms relevant to that area. The exact menu items visible depend on your profile and user group permissions.
Software-specific inventory and licensing are covered separately in the Software Asset Management Guide.
Tip: If you do not see a menu item you expect, it may be hidden by your profile or user group permissions. Contact your administrator to check your access rights.
Related Articles
- Analysing Discovered Data — using dashboard charts and queries to understand your estate
- Asset Health — what the Asset Health tile and tab show, and how each health rule is evaluated
- Hardware Analysis by Attribute — pre-built queries for analysing hardware by specification
- Discovered Data for a Single Asset — viewing detailed data for an individual asset
- Using the System — general interface navigation