Using the System
This page introduces the main xAssets interface: the toolbar, menus, dashboards, and search results screen. These are the building blocks you will use for every task in the system.
Toolbar Links
The toolbar at the top of the screen provides quick access to the most common actions:
| Link | Action |
|---|---|
| Home (Home icon) | Navigate to your chosen home page |
| New Asset | Create a new, manually entered asset of any kind |
| Last Asset | Return to the asset you last edited or viewed |
| Asset List | View a list of all assets |
| New Incident | Create a new incident record |
| Tasks | View outstanding tasks |

Tip: The Last Asset link is useful when you navigate away from an asset and need to return to it. It always takes you back to the most recently viewed or edited asset, saving you from searching again.
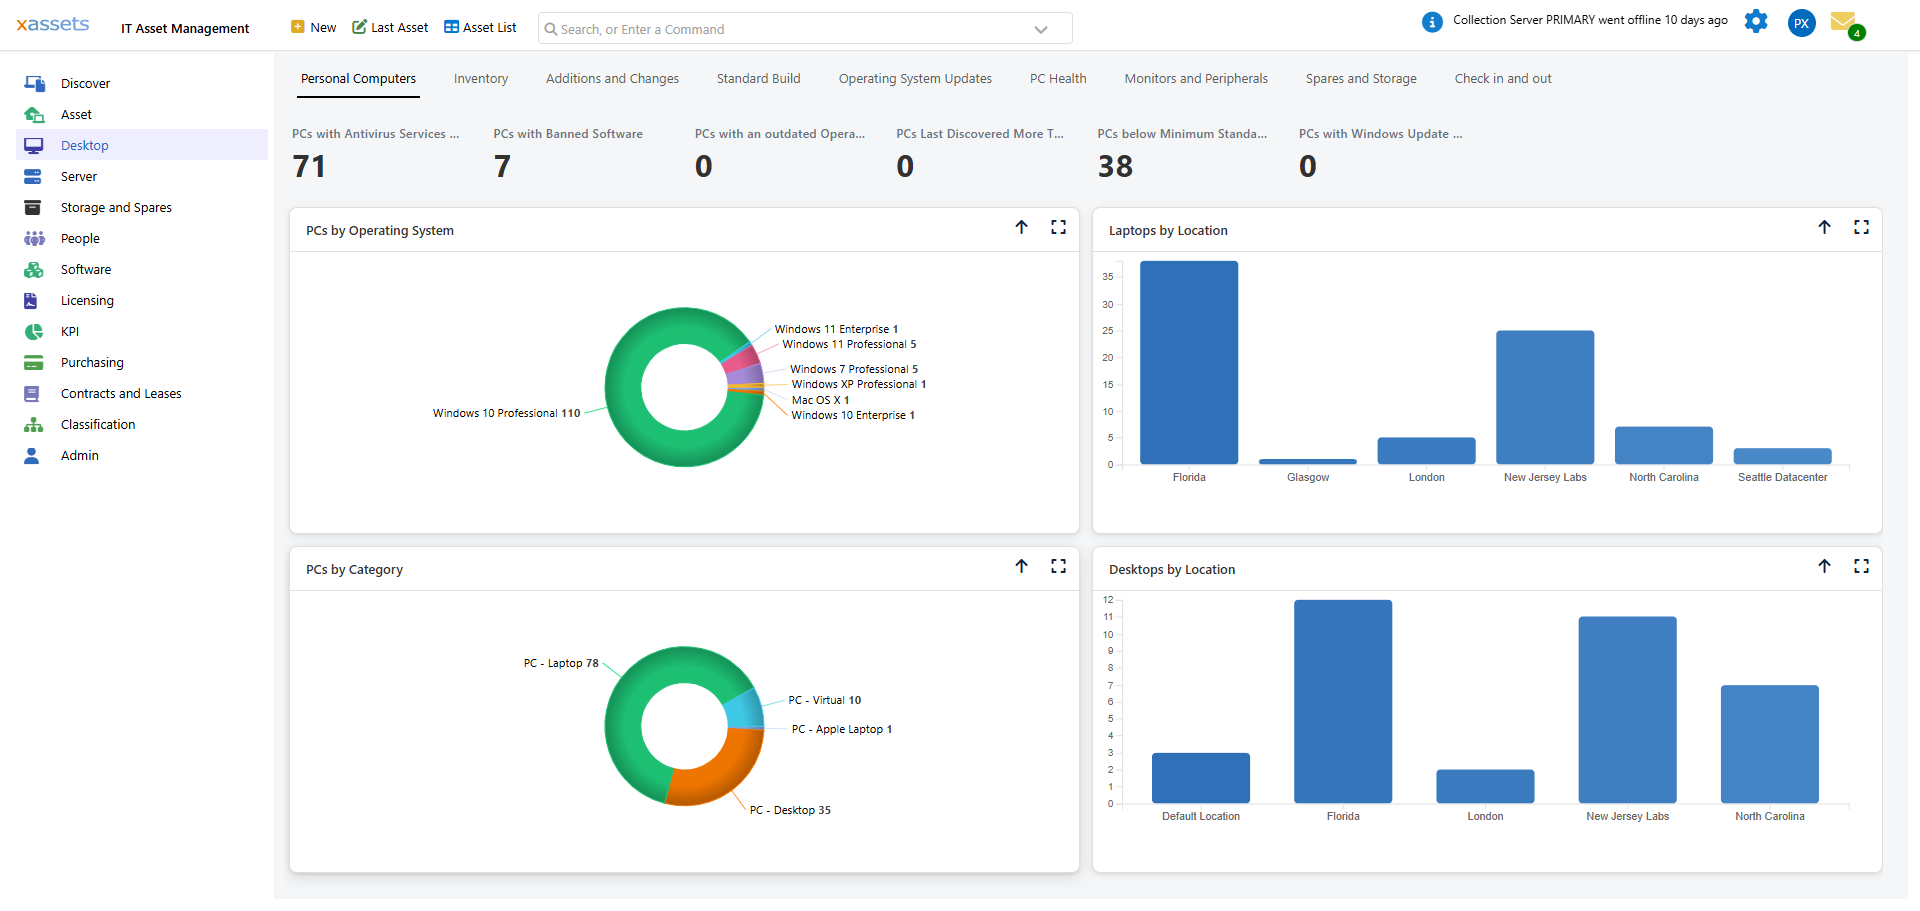
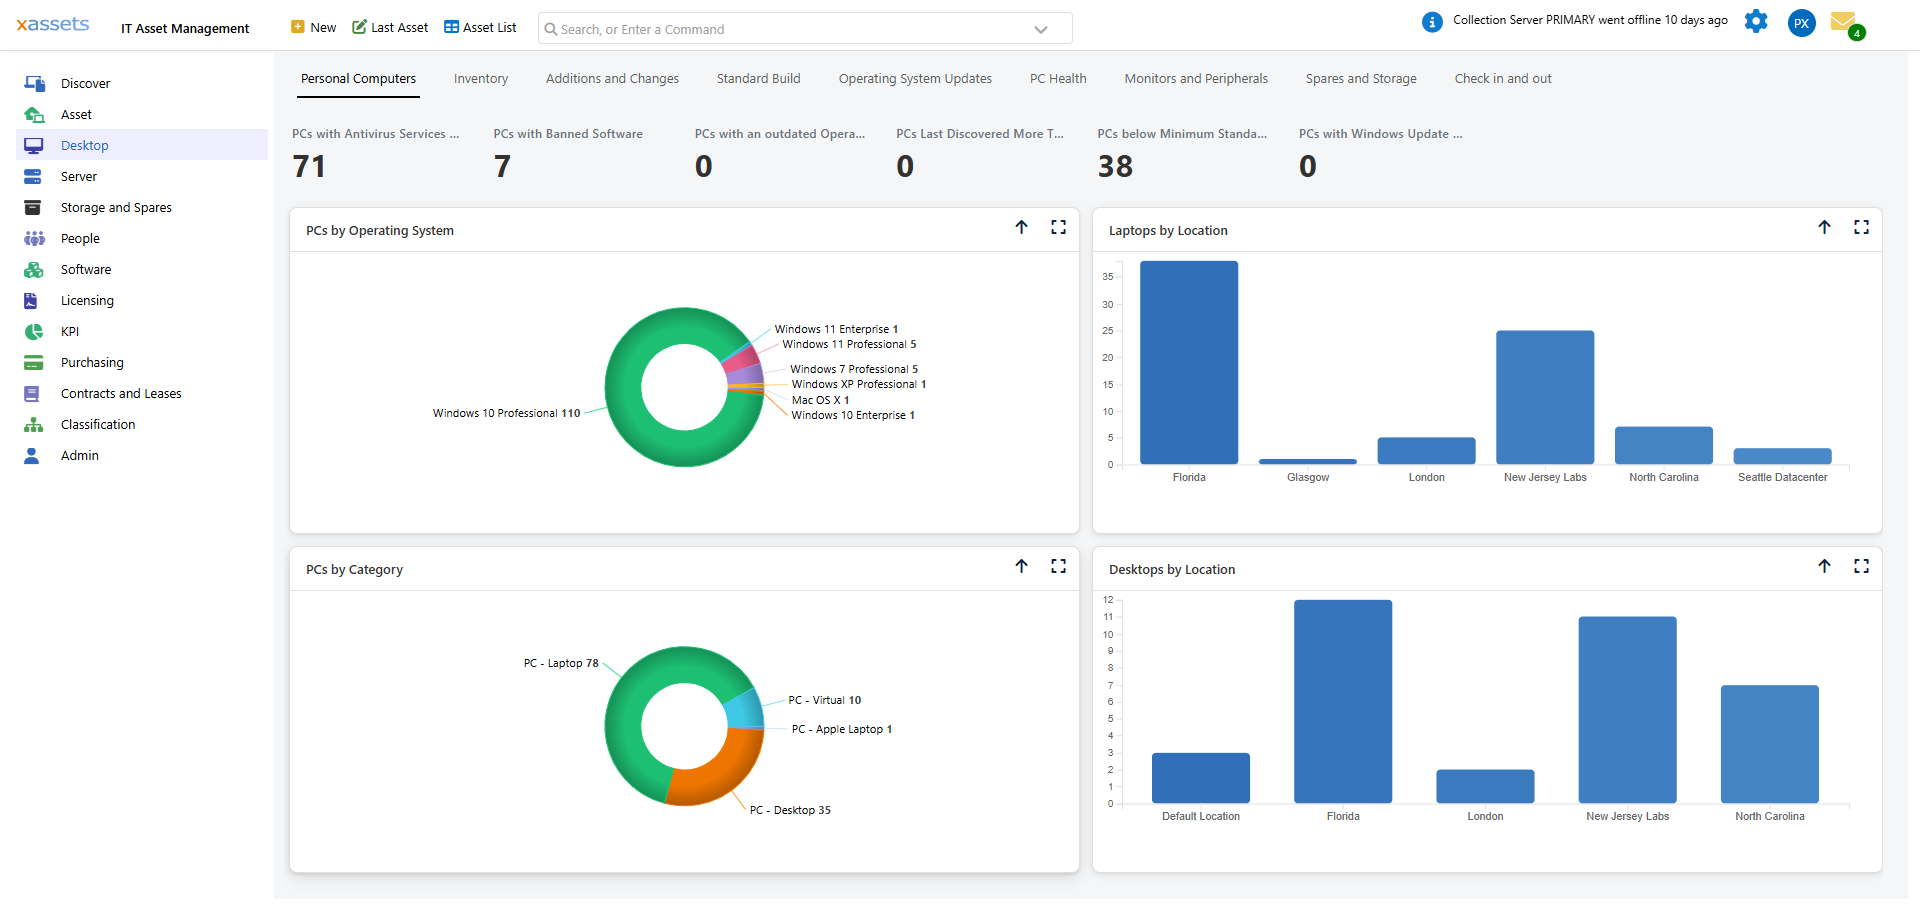
Dashboards
Dashboards provide a visual summary of your asset data through KPI tiles, charts, and pre-built queries. Each dashboard is designed for a specific area of the system (e.g., Asset Inventory, Software Compliance, Disposal).
Use the blue links on each dashboard to access that function. Charts and reports on dashboards support drilldown -- click a chart segment to zoom into that data. For example, clicking "Assets by Location" and then clicking a specific location drills into the assets at that location:
Dashboards are fully configurable. Your administrator can create custom dashboards with different charts, queries, and layouts. See the Configuration Guide for details.
Menu Bar
To access a function directly, click a menu item in the blue menu bar at the top of the screen. A dropdown menu will appear:

Click a blue link to execute that function. Major actions such as running a network discovery will prompt for confirmation before proceeding.
The menu items available depend on your profile and user group permissions. If you cannot see a menu item you expect, contact your administrator -- it may be restricted to your user group.
Pinning Items for Quick Access
Below the menu list at the bottom of the left navigator, a small icon bar fades in on hover. The pin icon ![]() opens your personal pin list -- queries, menu items, and individual assets you've pinned for quick access. Hover any menu item or asset description for a couple of seconds and a small pin icon appears at the right; click it to pin. See Pinning Items for the full walkthrough.
opens your personal pin list -- queries, menu items, and individual assets you've pinned for quick access. Hover any menu item or asset description for a couple of seconds and a small pin icon appears at the right; click it to pin. See Pinning Items for the full walkthrough.
Setting Your Home Page
To make any dashboard or screen your home page:
- Navigate to the page you want as your home page.
- Click the gear icon on the top right

- Select User Settings.
- Click Set Current Page as Home Page.
A confirmation message will appear. The next time you log in or click Home, that page will be displayed.
Tip: Choose a dashboard as your home page to get an instant overview of your responsibilities when you log in. For example, asset managers might choose the Asset Inventory Dashboard, while help desk staff might prefer the Tasks dashboard.
Chart Controls
Dashboard charts and tables have a set of small icons at the top for navigation:
![]()
- The blue up arrow

- The blue full screen symbol

In full screen mode, the View and Export link on the top right provides options to change chart types (pie, bar, table) and export data to Excel, PDF, or CSV.
Click any pie chart segment or bar chart block to drill down into the underlying data. Full screen mode is recommended for drilldowns, as asset-level queries display many columns that benefit from the extra screen space.
Search Results Screen
Most data in the system is viewed through the Search Results screen. Click Asset List on the toolbar to see it:

This screen displays query results and data lists. Click any blue link on an asset to open it for editing. The Search Results screen is highly configurable -- administrators can change which columns appear, the sort order, the tree hierarchy, and more. See Search Results for full details.
Tip: Spend a few minutes exploring the toolbar, menus, and dashboards when you first log in. The interface is consistent throughout -- once you understand how one dashboard, chart, or results screen works, the same patterns apply everywhere.
Related Articles
- Logging on for the First Time — how to access xAssets and sign in
- Preparing the Browser — browser requirements and configuration
- Pinning Items — bookmark queries, menu items, and assets for quick access
- Finding Assets — using search and tree navigation
- Search Results — detailed reference for the results screen
- Asset Inventory Overview — the main ITAM dashboard